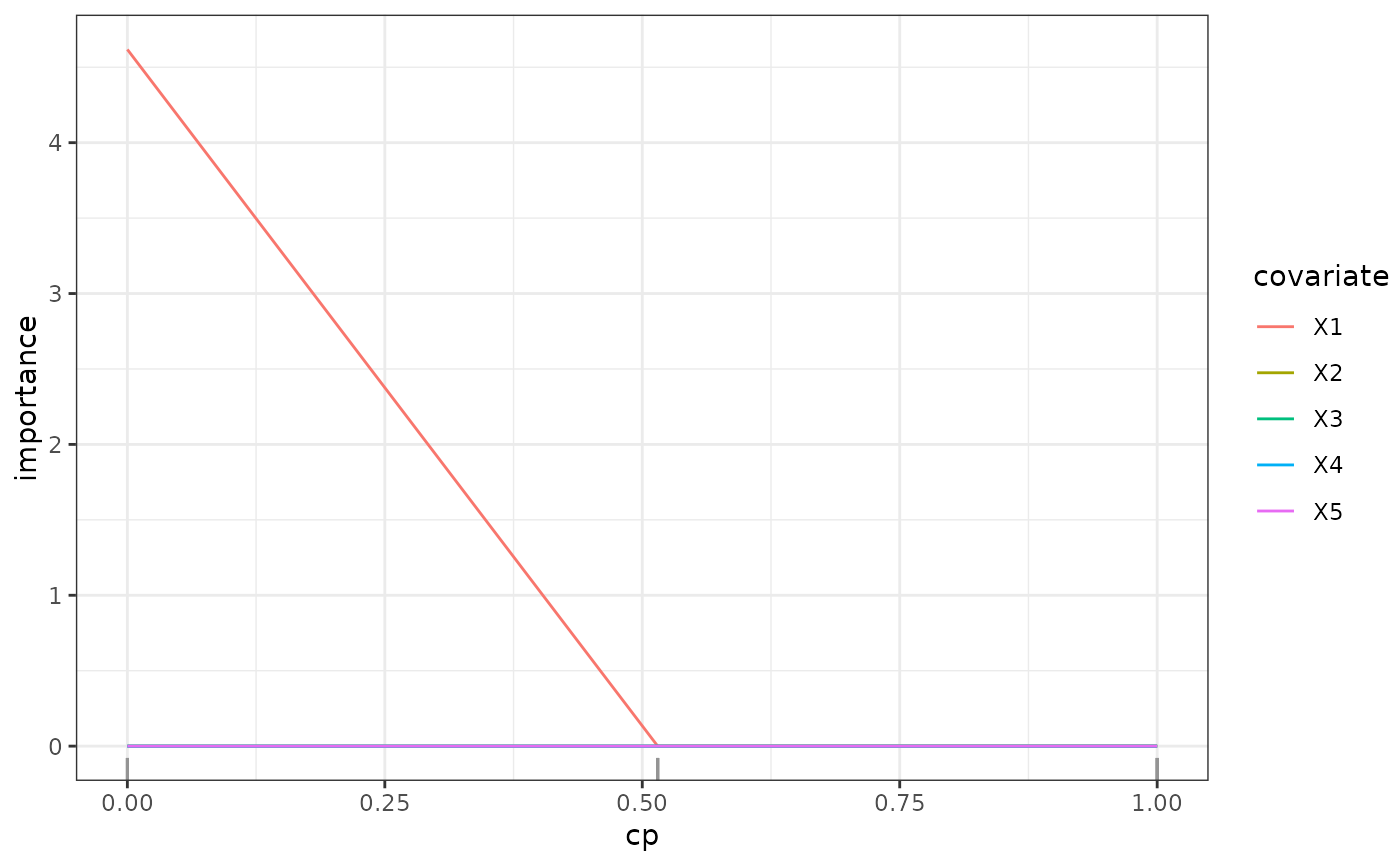
This function visualizes the variable importance of an SDTree or SDForest for different complexity parameters. Both the regularization path and the stability selection path can be visualized.
# S3 method for class 'paths'
plot(x, plotly = FALSE, selection = NULL, sqrt_scale = FALSE, ...)
Arguments
- x
A
pathsobject- plotly
If TRUE the plot is returned interactive using plotly. Might be slow for large data.
- selection
A vector of indices of the covariates to be plotted. Can be used to plot only a subset of the covariates in case of many covariates.
- sqrt_scale
If TRUE the y-axis is on a square root scale.
- ...
Further arguments passed to or from other methods.
Value
A ggplot object with the variable importance for different regularization.
If the path object includes a cp_min value, a black dashed line is
added to indicate the out-of-bag optimal variable selection.